Aryan Kumar, Johanna Hecht & Sara Marini
Hello! We are Aryan, Johanna and Sara from Lüneburg, Germany. We’ve been working together with Aurelia, Juan, Juliana, Karen, Milka and Neena from Gainesville, USA. Fun fact: this project was realized without us ever being all in one zoom room together.
Have you ever pedaled to your workplace or been grocery shopping by bike? The answer might vastly differ, depending on where you come from. In certain cultures, biking is part of people’s lives, in others an activity that only a minority is familiar with. In a rapidly changing world facing challenges of an unprecedented magnitude, biking could represent a staple for a better world. The health benefits of biking are undeniable and the contribution it can make to slowing down climate change is crucial. Biking hasn’t become as widespread as we wish it were. Yet. What are the reasons behind it? Why is it established practice in certain areas and completely absent in others? What makes a city truly bike-friendly? Is it the miles of bike lanes, the accessibility of bike-sharing services, or the safety measures in place? Perhaps it’s the cultural mindset that prioritizes sustainability and active living. We were intrigued to find out more and decided to conduct our project on the bike-friendliness of Lüneburg (Germany) and Gainesville (Florida).
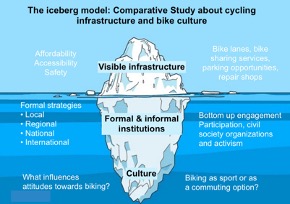
In our research journey we investigated more tangible elements like infrastructure and laws, but also factors which are less obvious and harder to measure such as cultural attitudes. To structure our findings, we’re using the so-called iceberg model (see picture 1). Think of it like this: what we see on the surface – bike lanes, parking stations- is just the tip. Below that, follow more concealed factors such as laws and regulations. If we dive deeper, we can uncover social and cultural factors shaping biking habits. But enough about methodology: let’s jump right into the content: Whether you’re a biking enthusiast, a city planner, or just curious about sustainable urban living, join us as we pedal through the perspectives of Lüneburg and Gainesville. Let’s discover together, what makes a city truly bike friendly.

The locations
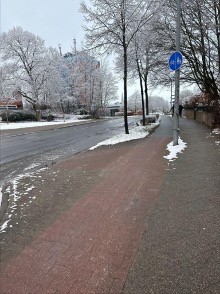
Close your eyes and feel the fresh air in your face. It’s raining lightly, but nobody seems bothered here. You are strolling through a city center paved by cobblestone, bikes are constantly passing by. You’re surrounded by beautiful red brick buildings, and you can hear some bells ringing. It’s a big medieval church in the historical neighborhood of the city. You are in Lüneburg, a charming town in Northern Germany with a long-standing biking culture.

Image 2: Caption: The wet cobblestone in the rainy Lüneburg
Aryan Kumar. (2022, April 5). City Center, Lüneburg [Photograph]. Personal collection
Now shake this picture away from your head and start to feel a warm breeze on your skin. You’re now surrounded by palm trees. It’s warmer here. Still, it rains even more than in Lüneburg. The streets are broader and busier. You hear the sound of laughter, students chatting and cars speeding by. You’re in the student city of Gainesville, a university city in the heart of Florida, USA. Younger than Lüneburg, yet already double its size and busting with life.

Now focus on the traffic around you. In Lüneburg it is quite easy to see bikes passing by. And, if you’re wondering: yes, also on cobblestone. While cobblestone isn’t the most comfortable terrain for biking, people in Lüneburg seem accustomed to it. In contrast, Gainesville is a car-dominated environment. The initial chats in the group of students already highlighted this difference. As we told them that it is normal for people here to bike to university, we could clearly see a glimpse of surprise on their faces. “Are you kidding?” Their eyes were giving their shock away. “It’s very hard to pedal back home after a full day at university.” We were surprised how different their perspective on biking was. These striking differences made the initial stages of the investigation ever more exciting.
Infrastructure: safety, accessibility and affordability of biking
The first factor we investigated was the actual infrastructure in the two cities. We imagined biking through a city without bike lanes. Would we still opt for a bike, or would we rather opt for driving a car or taking a bus? We can consider ourselves lucky in Lüneburg. The small city is covered by a quite dense network of bike lanes and also provides two public bike garages.

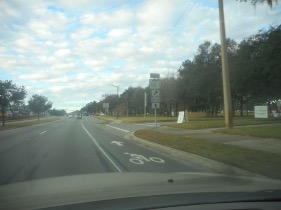
In Gainesville, bike lanes cover up to 25% of the city’s roads and are primarily concentrated along major roads across the city. The lanes in Gainesville help boost accessibility, but lack continuity. People in Gainesville highlighted how weather conditions might make it hard for people to bike, as no covered bike lanes exist.


Overall, a similar infrastructure has been detected in both cities; nevertheless, considering the smaller size of Lüneburg (about half of Gainesville), the German city seems to be, comparatively, better equipped than its American counterpart. Does being smaller make it easier?
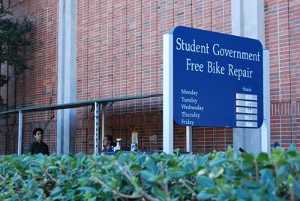
Another big factor influencing the accessibility of biking are the opportunities to buy a bike. We counted a total of 8 shops in Gainesville as well as in Lüneburg. For those who don’t own a bike, sharing services complement the offer in both cities. The prices are not directly comparable, because prices in Gainesville are fix and depend on the time spend on the bike Lüneburg. Still, it seems like the bike sharing in Lüneburg offers better deals for students as the first 60 minutes per ride are free and if you commute inside of Lüneburg no distance exceeds that duration. Additionally, Lüneburg offers a self-help bike repair shop (Konrad) as well as “quick repair points” throughout the city. Similar offers exist in Gainesville, but to a much smaller extent.
Overall, Lüneburg seems to offer a denser network of bike lanes and a wider array of biking services. While the investigation into infrastructure offered insights into one important factor influencing biking, we didn’t stop here. Do you remember the iceberg model? It’s time to dive below the surface.
Underlying institutions: top-down policies and bottom-up initiatives promoting or hindering biking
The second big area we investigated were regulations and initiatives in both cities. Both cities, shared the same focus: Biker’s safety (you can consult the Lüneburg Radverkehrskonzept here). Still, due to limited time and expertise in legal matters, it wasn’t possible to assess to what extent the policies are implemented. While formal regulations definitely play an important role in promoting or hindering biking, we realized that there is at least another big force shaping the behavior of people within a certain context: informal institutions. These include initiatives, embodying recurring patterns of behavior, shared wishes and enabling collecting action. On this side, an interesting picture emerged. In Gainesville, efforts are primarily pushed by institutional initiatives. Programs like Bicycle Friendly America advocate for safe biking infrastructure nationwide, while the Alachua County Bicycle Pedestrian Master Plan is currently in the works, aiming to improve roadways for cyclists and pedestrians. Public meetings allow citizens to share their concerns, though tangible results may take years to materialize.
In Lüneburg, grassroots efforts play a major role. Organised rallies and events such as the Kidical Mass encourage family-friendly biking advocacy, while the Stadtradeln campaign collects anonymous data to make the local infrastructure better. Further initiatives such as Radentscheid and NUMP (Nachhaltiger Urbaner Mobilitätsplan) promote civic engagement, encouraging public dialogue and actionable solutions for improving bike safety and accessibility. The ADFC (Allgemeiner Deutscher Fahrrad-Club) further improves efforts by supporting bike-friendly policies across Germany.


Culture: the ultimate reason for all visible patterns?
Looking at the regulations and events underlying the infrastructure and services gave us more insight, but it still didn’t explain the differences in attitude. The two locations are too similar to be this different!
To complete the picture, we turned to the deepest level of our iceberg: culture. After hitting a stone wall with desk research, we decided to go straight to the source and adopt a hands-on approach: we prepared our own questions and hit the streets. Through interviews and data analysis, we aimed to investigate the cultural norms surrounding biking sought to uncover the key factors shaping attitudes toward cycling in these two cities. Our goal: talk to people and find out how they feel about biking. If you’re curious about the technical details of our interviews, follow this link. Collecting our own data on the ground was quite time- intensive, but provided invaluable insights into the cultural backdrop underpinning biking in these two areas, potentially influencing everything else we had discovered in our research.
In the first part of the interviews, we explored respondents’ actual commuting behaviors. In Lüneburg, 64% of the interviewees reported commuting by bike, citing reasons such as convenience, affordability, health benefits, and environmental friendliness. In contrast, the preferred commuting method in Gainesville appeared to be the car. Over half of the respondents in Gainesville did not even own a bike, and a striking 90% stated outright that they would never consider commuting by bike.
The second part of the interview investigating the associations that people have with biking in the two cities revealed a very interesting difference: while in Lüneburg nearly all respondents saw biking as a commuting option, nearly three quarters of interviewees in Gainesville associated biking with sport or recreational activity. The overall conclusion that we could draw from this phase of our research is that the vastly different biking behaviors in the two cities seem to be deeply rooted in people’s relationship with biking.
So what? Lessons learnt
After presenting these findings, one central question remains: what makes a city truly bike-friendly? The widespread use of bicycles in Lüneburg appears to be supported by all three layers we investigated: an extensive infrastructure, favorable policies and grassroots initiatives, and cultural perceptions that regard biking as an integral part of daily life.
While the interplay between infrastructure and cultural mindset is evident, understanding the causal relationship is far more challenging. Does better infrastructure shape the attitudes of residents, or is it a reflection of existing mindsets? Where is the most effective leverage point if we aim to transform the mobility sector? Should efforts focus on campaigns to shift public perceptions of biking, with the expectation that new policies and infrastructure will follow increased demand? Or should we prioritize investing in infrastructure, trusting that it will prompt a change in people’s values and habits?
Due to time constraints, our project could only scratch the surface of this complex and fascinating topic. However, one thing is certain: given the significant implications of transportation choices on air quality, noise pollution, and public health, understanding how to drive positive change toward more sustainable options like biking is more urgent than ever. In a world suffering under fossil fuel consumption and health diseases, shifting infrastructure, institutions, and cultural values surrounding biking really appears to be a stepping stone towards a more desirable future: a small pedal stroke for a human, a giant leap for humankind.
References
Alachua Countywide Bicycle Pedestrian Master Plan https://growth-management.alachuacounty.us/Planning/BikePedMasterPlan (07.03.2025)
Radentscheid Lüneburg. Sicheres Radfahren für alle. Für das Klima. Für Lüneburg. https://radentscheid-lueneburg.de/ (15.11.2024)
Stadtradeln. Lüneburg im Landkreis Lüneburg. https://www.stadtradeln.de/lueneburg (18.11.2024)
Hansestadt Lüneburg: Europäische Mobilitätswoche. https://www.hansestadt-lueneburg.de/_Resources/Persistent/e/4/b/7/e4b7ff541f7e9bccd5be8d46caa7c49146ab60b8/2024_Mobilit%C3%A4tswoche_Flyer-1.pdf (17.11.2024)
Hansestadt Lüneburg – Nachhaltiger Urbaner Mobilitätsplan. https://www.hansestadt-lueneburg.de/bauen-und-mobilitaet/mobilitaet/nump.html (12.11. 2024)
Hansestadt Lüneburg – Radverkehr. https://www.hansestadt-lueneburg.de/bauen-und-mobilitaet/mobilitaet/radverkehr.html (13.11.2024)
StadtRAD Lüneburg:
https://stadtradlueneburg.de (07.03.2025)
AStA Lüneburg:
https://www.asta-lueneburg.de/mobilitaet/stadtrad (07.03.2025)
Landkreis Lüneburg: Radverkehrskonzept für den Landkreis Lüneburg. https://www.landkreis-lueneburg.de/fuer-unsere-buergerinnen-und-buerger/mobil-im-landkreis/radfahren/radverkehrskonzept.html (13.11.2024)
Lünepedia: Kidical Mass. https://www.luenepedia.de/wiki/Kidical_Mass (18.11.2024)
New city roads to include bike lanes, safety measures for cyclists and. (2022). Gainesvillefl.gov. https://www.gainesvillefl.gov/News-articles/New-city-roads-to-include-bike-lanes-safety-measures-for-cyclists-and-motorists (07.03.2025)
Niedersachsen: Radverkehr in Niedersachsen. https://www.mw.niedersachsen.de/startseite/verkehr/radverkehr/radverkehr-15422.html (16.11.2024)
Interview outline
A) Demographics & actual use of car/bike
● Age / Profession
● Commuting: frequency, average time and preferred means of transportation
● Why do you use this means of transportation? [open answer]
● Do you have a car / a bike? → reasons why / why not
B) Deeper perception / values influencing that behavior
● (If they say that they mostly commute by car): Would you start commuting by bike? Why / why not?
● What are your first associations when you see people biking? Is it a sport? Is it a reasonable commuting option? Too poor to afford a car?

